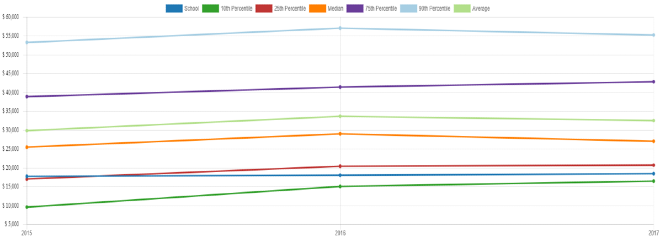
Above: Sample graph of Midwest independent schools' revenue per student, from BIIS.
In the recent webinar, “Better Your School with NBOA Data: Benchmarking and Analysis with BIIS,” Mary Kay Markunas, NBOA’s director, research and member resources, and Jennifer Hillen, vice president, professional development, explained the basics of benchmarking with BIIS, how it differs from NAIS’ DASL (Data and Analysis for School Leadership) and how business officers can use it to analyze data on everything from the market’s perception of your school to affordability to institutional efficiency.
Benchmarking Basics
Independent schools benchmark for internal and external uses. Internally, for example, schools can see how their faculty salaries and student-teacher ratios stack up against peers’, or the health of their business office: “You want to make sure you’re providing adequate coverage for everything and no one’s feeling too burdened,” said Markunas. Externally, business officers can share data with the board, parents, bankers and financial advisors to help those parties make better decisions.

Unlike previous NBOA reports, BIIS is an interactive platform that allows users to create their own cohorts, based on school enrollment and plant size, location, type, endowment and other factors. Different cohorts may be useful for different data sets. “You may look to one cohort to do your financial benchmarking and to another cohort to do your compensation benchmarking,” said Markunas. BIIS allows schools to produce “apples-to-apples” comparisons as well as aspirational comparisons.
Why BIIS?
How is BIIS Different from NAIS’ DASL Platform? BIIS provides more detail where business officers need it. “We have a smaller dataset than DASL,” elaborated Markunas. “BIIS is more refined and better suited to financial and business operations than DASL… BIIS is more detailed, but narrower in scope.”
Markunas reminded attendees that NBOA developed BIIS because some of the companies that produced previous NBOA reports had gone out of business. In addition, static PDFs (previous report formatting) have limited comparison capabilities. NBOA also expects BIIS to reduce survey fatigue, as business officers will only have to enter data once a year. Ultimately, she noted, NBOA would like to make data portable between BIIS and DASL.
Better Conversations
Business officers can curate the data for decision-makers by homing in on points that speak to the school’s strategic plan, explained Hillen. She recounted that when serving as associate director of finance and operations at Harpeth Hall School in Nashville, “I tried to create a dashboard, and it ended up being 497 lines long.” That’s not a dashboard, she noted. “That is, I don’t know, an albatross of data.” While at Harpeth Hall, she transformed that albatross into something usable by focusing on data that spoke to “10 markers of success,” originally created by former NAIS President Pat Bassett. Hillen’s spin on those markers:
- Market’s perception of school success
- Constituent loyalty/generous giving
- Capacity to attract, keep and reward high-quality faculty
- Tuition remission
- Comparative affordability
- Commitment to diversity
- Institutional efficiency
- Investment in a high-quality learning environment
- Commitment to financial security, intergenerational equity and long-term stability
- Student success
In the webinar, Hillen provided further detail on how she developed data points to assess the above markers and present charts to the board — steps business officers can take using BIIS data. Markunas demonstrated how to use the BIIS platform and answered questions about past years’ as well as missing and incorrect data. To access the video, slides and transcript, visit NBOA’s webinar archive. NBOA members can enter data in BIIS until April 30. Contact Mary Kay Markunas with questions.


