Article by Chad Stacy, Dunn School
When I joined Dunn School in 2010, this independent boarding and day school on California’s Central Coast had narrowly survived the worst economic downturn in recent memory. Two years earlier, when Mike Beck arrived as the new head of school, the recession was bearing down with a brutal intensity. Dunn’s average freshman class of 38 had shrunk to 18. Financial aid was stretched an additional 20 percent to meet the needs of families whose homes were underwater or in foreclosure. The market value of the school’s endowment had dropped below its restricted balance, and the global credit crisis required the temporary freezing of those assets. Moreover, the school had no cash reserves, the line of credit was fully drawn, and the following year’s tuition deposits and prepayments were funding operating costs. And with such a small incoming class, cash was burning fast.
The first order of business was swift and difficult. To sustain operations over the short term, the school’s leadership team, including Beck and the trustees, had no choice but to implement immediate and sizable layoffs. They cut nearly 15 percent ($1 million) from the school’s budget, in a series of painful but necessary decisions that impacted beloved programs and people alike. Equally challenging would be the longer-term task of rebuilding the school’s financial foundation. We began this effort in earnest in 2010.
Six years later, our confidence in and ongoing use of the heat map is backed by data showing continuous improvement.
With institutional sustainability a key pillar of Dunn’s new strategic plan, we formed a financial sustainability committee charged with the specific goal of resetting the school’s finances. Then, we embarked on an honest assessment of the school’s financial challenges, committed to crafting a vision for the path forward, and eventually created a tool we called the financial sustainability heat map.
Six years later, our confidence in and ongoing use of the heat map is backed by data showing continuous improvement. Although our heat map metrics are unique to Dunn School, we believe that other independent schools could adopt similar models to measure and track their sustainability.
Never-Ending Journey
By embracing sustainability, Dunn’s leadership had effectively decided that the school was important enough to exist forever. But what indicators would reveal progress toward that sustainability? How would we measure an abstract concept like institutional perpetuity?
Financial dashboards were possible tools. Many schools use these to help trustees and other leaders visualize key financial and non-financial metrics that are important to the operation of the school. (See the article "Picture This" for more on financial dashboards, as well as "Refining Your Data.") Dunn used dashboards at the time too, but after the economic downturn we felt that dashboards lacked the context of continuous improvement and the larger picture of total school improvement. We envisioned sustainability not as a point in time, but as a journey — albeit to an impossible destination. Dunn’s Sustainability Team wanted a tool that would clearly communicate the school’s journey along this path and would celebrate milestones along the way.
In developing this instrument, we took note of school rankings. Most institutions have regional peer groups against which they benchmark themselves, both formally and informally. We compare quantifiable items like budget size and endowment size, along with qualitative items like college lists and facilities quality. With this benchmarking, school communities typically gain a sense of the perceived sustainability of their peer schools. The Sustainability Team at Dunn was searching for a single and simple financial metric that could capture and rank the relative sustainability of our peer schools.
Key Indicators
We found that answer in a simple calculation drawn from schools’ IRS Form 990s — specifically, metrics on their balance sheet and income statement:
net assets / total expenses =
the sustainability ratio
Intuitively, this made sense. A school’s net assets include its cash reserve, endowment and capital assets, minus debt. Dividing net assets by expenses helps to rightsize this number so that smaller and larger institutions can be measured side by side. The larger the relative balance sheet, the more likely the sustainability — in practical terms, the ability to weather economic cycles, fund emerging opportunities and adequately resource student and staff recruiting.
By collecting our peer schools’ sustainability ratios in a simple chart format, the situation became clear. All the peer schools with high “perceived” rankings also ranked high using our sustainability ratio. Likewise, the schools that appeared to be struggling ranked near the bottom.
The sustainability ranking identified the path and showed us our position on it. The good news was that the team found a key sustainability metric. The bad news was that our ranking was near the bottom of our peer group.
Having acknowledged the long journey ahead, the team set out to break it down into manageable and measurable milestones. We began by identifying immediate roadblocks that could challenge our sustainability. At the end of the global credit crisis, Dunn was one nervous banker away from having our debt called. Thus, our debt covenants became the backbone of a group of metrics that we categorized as “minimum fiduciary standards.”
Next, we created more aspirational metrics that we categorized as “institutional advancement metrics.” These included long-term, growth-oriented metrics such as balance sheet growth, planned giving growth and endowment support ratio. In all, we identified 12 specific metrics within these two categories. Collectively, they formed the basis for our sustainability reporting.
The Heat Map
Proud of our hard work, Dunn’s Sustainability Team was eager to share our findings with the board of trustees. We assembled a lengthy presentation full of charts, graphs and numbers. We presented each metric in great detail: definitions, sources, rationales. But despite our solid metrics and important goals, we overwhelmed our audience. In our efforts to fully educate the trustees about each metric, we failed the communications test. We had lost the forest for the trees. Our work was not done.
Following this less-than-stellar debut, the committee re-convened to build a better reporting tool. Our goals were threefold:
- Display all metrics against their goals on one page.
- Compare the results over time so improvement can be tracked.
- Make it user-friendly.
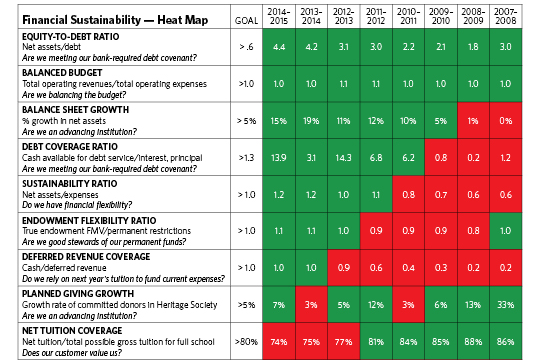
How did we combine 12 metrics, 12 goals and eight years of data (108 data points) into a one-page, user-friendly presentation? Our solution took the form of a red-and-green color scheme. We call this tool the “heat map.” The red sections are unmet goals; red color suggests heat and a sense of urgency. The green sections indicate that goals have been met; green appears to cool the red. The visual nature of the display allows even the casual user to quickly assess the school’s progress and opportunities on its journey to sustainability.
Advance and Iterate
Our new heat map would track and measure progress, but how would we bring it to life? How could we use it to motivate behavior and influence decisions? Basically, to make our heat map an effective decision-management tool rather than just a dashboard, we needed for it to always contain many unmet (red) goals. Our rationale was that an entirely green map could prevent us from continuing to strive for improvement. To that end, we set some challenging long-term improvement goals. Many, we felt, were achievable in a three-to-five-year window, but several others might take a decade of hard work to achieve.
"To make our heat map an effective decision-management tool rather than just a dashboard, we needed for it to always contain many unmet (red) goals. Our rationale was that an entirely green map could prevent us from continuing to strive for improvement. We set some challenging long-term improvement goals that might take a decade of hard work to achieve."
Chad Stacy
Dunn School
Consider one metric as an example of how the heat map helped motivate us and influence our behavior. For the “sustainability ratio” metric, we agreed to a goal of 1.0 — that is, this metric would turn from red to green once net assets exceeded total expenses. In order to make that happen, the board and administration worked hard to flat-line expenses, reduce debt, invest in capital improvements and grow the endowment. Each of these initiatives required action plans and execution from Dunn’s finance, facilities and development teams. The heat map’s sustainability ratio goal was constantly on our minds as we executed the day-to-day and strategic decisions that were required for us to achieve it. Within four years, we turned our sustainability ratio from red to green.
As of the 2014 – 2015 school year, the Dunn School heat map looked like this (see feature image above). As the years advance and Dunn’s heat map cools, it continues to evolve in other ways. With many minimum fiduciary standard metrics now solidly green, we have added new institutional advancement metrics. If a goal is met but the underlying metric remains relevant, we reset the goals to encourage another three to five years of improvement. Moreover, each year we update the heat map metrics, refresh our peer comparables and archive the results. With this approach, our sustainability efforts are always fresh and relevant, yet the journey itself continues to exist in vivid historic form.
Confidence Backed by Data
When Dunn consciously embraced institutional sustainability in 2010, a trustee commented that it was a bit unfair to compare our school — then a relatively young 53 years old — to some of our peers with much longer operating histories. He argued that the older an institution, the more time it had to amass a large balance sheet through planned giving and successful capital campaigns. And that is our point exactly. We now know what sustainable institutions look like, and we have made it our duty to embrace the initiatives that will allow us to be among them.
Guided by the heat map, our current and future leaders are committed to continuous improvement. And each year we move a bit closer to our unreachable goal of perpetual operation.
Chad Stacy is chief financial officer at Dunn School, a boarding and day school located among the ranches and wineries of Santa Barbara County in California. His last contribution to Net Assets was “Engines of Entrepreneurship,” which appeared in the March/April 2015 issue.


