Article by Mary Kay Markunas
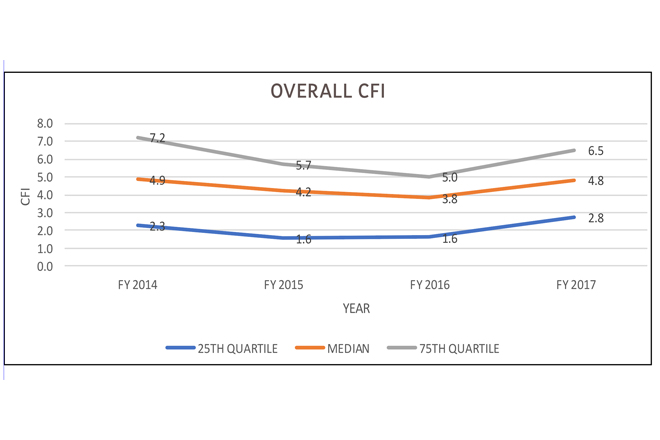
Above image: Overall CFI trends: Approximately one third of the schools had scores that indicated financial fragility (CFI 0 – 3), one third were financially stable (CFI 3 – 6) and the final third were financially strong (CFI 6 – 10).
The first fruits of independent schools calculating their Composite Financial Index scores are in. Originally developed to help college administrators conduct more meaningful board conversations about their institutions’ financial health, the CFI can enhance independent schools’ strategic planning efforts and also help business officers draw attention to financial indicators that might not be clear to board members and other school leaders.
Calculating the CFI involves two main steps. The first is to determine if a school has sufficient liquidity to meet its obligations. The second is to calculate four core financial ratios:
- Primary reserve: a measure of the school’s financial flexibility
- Viability: a measure of the school’s ability to cover debt with available resources
- Return on net assets: a measure of the school’s overall asset return and performance
- Net operating revenues: a measure of the school’s overall operating performance
Analyzing these ratios along with the composite score over stretches of five, 10, 20 or more years will depict a school’s financial well-being over time.
Case Studies
In March, 53 schools participated in the 2018 NBOA Senior Leaders Seminar, “Strategic Financial Analysis and Communication Using the Composite Financial Index,” a preconference to the 2018 NBOA Annual Meeting. CFI co-creator and consultant Phil Tahey led the seminar, and NBOA board members Chuck McCullagh and Nancy Greene provided case studies of how they have used the CFI at their schools.
Greene, then chief finance and operations officer at The Bolles School, said that the school’s component ratios as much as its composite score helped its financial planning. (Greene is now CFO at Pine Crest School.) While Bolles seemed cash-rich, as indicated by its viability ratio, its financial strength and flexibility needed improvement, as indicated by its primary reserve ratio. Calculating the CFI over a five-year period helped Greene convince the board that the school needed to adjust its financial planning. Financial stability has significantly improved.
McCullagh, CFO at The Williston Northampton School, said its CFI confirmed the success of a new financial model the school developed following the 2008 financial crisis. Before learning about the CFI, he used liquidity ratio, debt service coverage ratio, investment against depreciation, net tuition revenue trends and discount rate trends to assess the school’s financial health, but the CFI gave a broader picture of financial stability over time. It has also helped the board of trustees understand the financial performance of the school, McCullagh said.
Trends in Independent School CFI Scores
Although the CFI is not a benchmarking tool, the number of schools participating in the Senior Leaders Seminar (53) allowed for some analysis of the scores. (Prior to the conference, all schools submitted a spreadsheet with their audit and five years of 12 key data points to Tahey, who calculated the scores.) Overall, approximately one third of the schools had scores that indicated financial fragility (CFI 0 – 3), one third were financially stable (CFI 3 – 6) and the final third were financially strong (CFI 6 – 10). (See feature image above.)
The group’s median primary reserve ratio (chart below) was above the threshold of 0.4. This threshold represents five months’ worth of expenses in reserve, sufficient for a school to weather a moderate challenge without difficulty. The very low ratio for schools in the 25th quartile, however, indicated severe stress and approximately one month of expendable equity.

Participating schools’ median viability ratio (chart below) was at the threshold value, indicating that 50 percent of the schools could settle their debt at that point in time. The schools in the 25th quartile were highly leveraged, questioning their ability to repay debt.

Schools’ return on net assets ratio (chart below) followed investment returns as well as the impact of capital campaigns and annual fundraising. The threshold value of 6 percent represents a nominal return on assets including inflation. It is an indication of how schools are fulfilling their stewardship responsibilities.

Following the enthusiastic response to the 2018 Senior Leaders Seminar, NBOA will present on the CFI again next March prior to the 2019 NBOA Annual Meeting in San Diego. Further information can also be found in Tahey’s book, “Strategic Financial Analysis for Higher Education: Identifying, Measuring & Reporting Financial Risks.”


