Article by Mary Kay Markunas
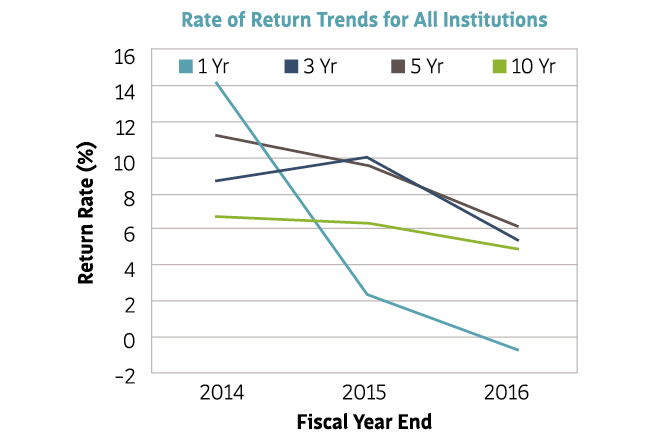
With apologies to Frank Sinatra, 2016 was a very poor year for returns on independent schools’ endowment portfolios — even among the most “independent” thinkers. As illustrated in the 2016 “Commonfund Benchmarks Study: Independent Schools Report,” the 211 participating schools’ one-, three-, five- and 10-year return rates were lower than in the 2015 report. Many schools have changed their asset allocation mixes to reverse the downward trend, but by year end the adjustments hadn’t made a notable difference.
Return Trends
The chart above (featured image) shows the overall declining rates of return for all institutions during the four time periods studied.
The chart below, showing 10-year returns, is concerning, as most schools have a 4 to 4.5 percent draw rate on their endowments. That, combined with the 10-year annualized Consumer Price Index (CPI) of 1.8 percent, creates a high hurdle for endowments to clear to both protect the principal and provide sufficient income to accommodate the budgeted draws. Schools are losing ground.

Asset Allocations
One strategy for winning this battle is for schools to change their endowment’s asset allocation. Over the past 10 years, schools’ overall mix of asset classes has shifted, primarily among smaller endowments. Alternative strategies have become more popular with schools whose endowments are $50 million or less. The table below shows the shifts between 2006 and 2016.

Find much more information in the full report (free for NBOA members).
Mary Kay Markunas is NBOA’s senior manager of member resources and industry research.
Download the PDF of this article.


