Article by Mary Kay Markunas
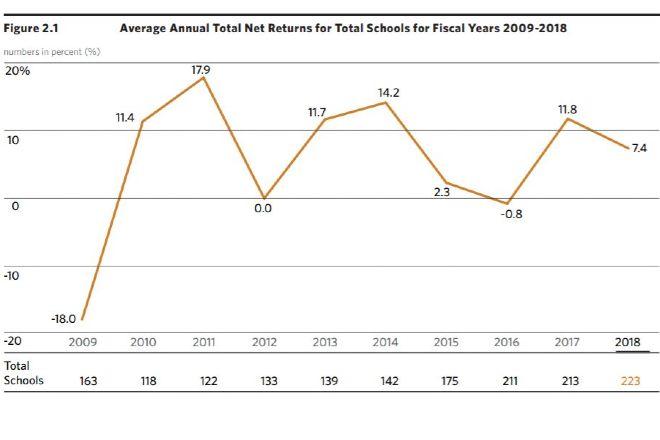
Feature Image: Average annual total net returns for total schools for fiscal years 2009-2018, from the 2018 Commonfund Benchmarks Study of Independent Schools
Independent school endowments rose an average of 7.4 percent net of fees in fiscal 2018, according to data from 223 participating schools in the 2018 Commonfund Benchmarks Study of Independent Schools. The returns, which cover the period from July 1, 2017 to June 30, 2018, represent a decline from 11.8 percent in fiscal 2017, but an increase over fiscal years 2016 and 2015, when respective returns were -0.8 percent and 2.3 percent. The study was conducted by the Commonfund Institute and NBOA.
Participating schools — which included 145 day schools, 35 day/boarding schools, 26 boarding/day schools and seven boarding-only schools — represented some $12 billion in combined endowment assets in fiscal 2018. Results are segmented into three cohorts based on size: endowment assets greater than $50 million (average return of 8.2 percent); assets between $10 million and $50 million (average return of 7.4 percent); and assets under $10 million (6.2 percent).
The average annual effective spending rate was 3.8 percent of endowment for all schools, up from 3.7 percent in fiscal 2017. Schools in the largest endowment cohort spent at the highest rate (4 percent). The most frequently used methodology (for 69 percent of schools) was to spend a percentage of a moving average of endowment value. Schools reported an average 7.3 voting members of investment committees, the majority of whom were investment professionals.
Asset allocations changed little in fiscal 2018 compared to the previous year.
|
Asset Class |
2018 |
2017 |
|
U.S. equities |
28% |
27% |
|
Fixed income |
13% |
13% |
|
Non-U.S. equities |
22% |
20% |
|
Alternative strategies |
33% |
35% |
|
Short-term securities/cash/other |
4% |
5% |
The study also includes an in-depth analysis of 10 years of survey data from Commonfund and NBOA. Selected highlights from the longer-term returns:
- Schools' spending patterns changed markedly over the course of the decade. From 2009-2013, the average effective spending rate for all institutions was 4.3 percent. For the second half of the period, the average declined to 3.7 percent.
- Schools with assets over $50 million reported the highest return for three, five and 10 years — 6.3 percent, compared to 6.1 percent for the other two size cohorts.
- Trailing three-year returns averaged 6.2 percent across all cohorts. Trailing five-year returns averaged 7.3 percent. Trailing 10-year returns averaged 5.5 percent, even including the -18 percent return of fiscal 2009.
- Gifts and donations strengthened over the period. Average giving reached a high of $2.1 million in fiscal 2017. The second- and third-highest years for giving were fiscal 2018 (average $1.8 million) and fiscal 2016 (average $1.6 million).
- In six of the 10 years, investment returns were sufficient to cover spending, inflation and investment management costs.
Expanded data involving the different cohorts and more analysis of long- and short-term returns, asset allocation, strategies, fund flows and more are available in the full report.


