Article by Mary Kay Markunas
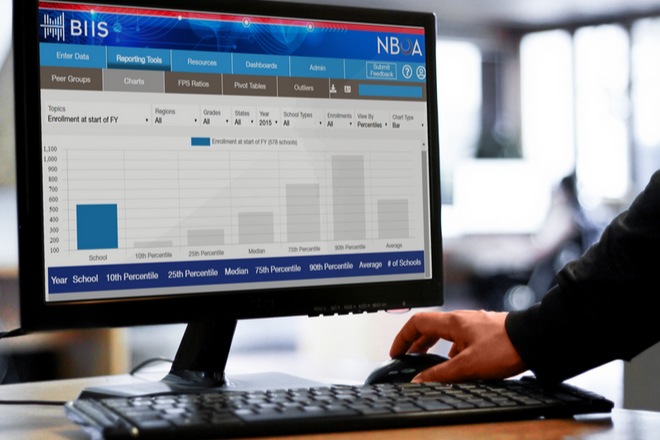
Yes, it is that time of year again when every association and organization your school belongs to is looking for data. NBOA’s BIIS platform (Business Intelligence for Independent Schools) is among them, with refinements to the system that will ease data entry – and assessing your school’s financial health.
These include:
- Tools that help school administrators and the board understand your school’s long-term financial outlook are now deeply integrated into the BIIS platform. Data points used in The NBOA Financial Dashboard, composite financial index (CFI) and financial position survey ratios are now highlighted in BIIS and displayed in different tabs, so it’s clear what information feeds each of those tools. Some data points are used in multiple tools, so they appear on multiple tabs, but fear not, you need enter the data only once.
- Following a user feedback survey conducted in spring 2019, we have removed some questions about business officer demographics and governance, which weren’t actionable (if interesting in themselves). This means fewer data points to enter.
- New user guides offer tips on data entry and the reporting tools. These were developed in response to the user feedback survey.
- We created a tool to cross reference data points common to BIIS and DASL and identify where they reside in each platform.
- Historical data contributed to the Commonfund Institute’s study of independent school endowments from 2014 to 2018 will become available in October 2019, and fiscal 2019 data will become available in February 2020, after the study is released. Users can benchmark, apply filters and create peer groups for the endowment data, as they can for all other BIIS data. This gives schools the opportunity to view the data outside of the preset endowment size groups that Commonfund uses, providing additional information for investment committees.
Fall is also the time schools start thinking about next year’s budgets, and the NBOA Financial Dashboard has several charts that can assist you in evaluating where you’ve been and planning where you are going. Updates to the tool allow you to benchmark your progress relative to peer groups. Especially helpful in the budgeting process are four of the charts on the dashboard’s first page: net tuition revenue, total enrollment with financial aid and tuition remission, operating income and operating expenses. Tracking the components of your income and expenses over time gives the finance committee and full board the information to understand how the allocation of resources (income) to the program (expenses) enable the school to fulfill its mission and vision.
As always, if you have questions about the data entry process or BIIS, contact Mary Kay Markunas
Mary Kay Markunas is NBOA’s director, member resources and programs.
Download a PDF of this article.


